Aborting the Red Eye Monitor project and next steps

June 7, 2011

This project has been a success from many standpoints, but getting internal adoption has not been one of them.  Comprehensive automation is very hard to grasp, as being comprehensive it is quite extensive and detailed.

I’ve weighed my time costs in releasing the system as it is, and I don’t think it’s worth the support requests, if it gained any interest, until the topic of comprehensive automation has been documented and has a base of understanding in the industry.

I’m going to re-focus my home efforts to document how to create comprehensive automation, and methods I used in the REM project, and perhaps once I have explained how things work and have some grass roots support for wanting this kind of automation a release would be warranted.

I’m going to go back and break up the project into updated component pieces and release those as separate open source technologies and use them as examples for documenting how I comprehensively automate things.

I’m going to leave this blog up as a place holder, but all new writing will be posted at the more general site:

ge01f.wordpress.com


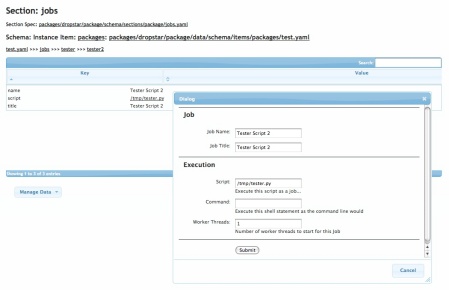
Automation Package Editor Screenshot

February 15, 2011

I’m making pretty good progress on the GUI to edit the internals of the system.  I’m sticking to a pretty basic approach, with just a few goals:

  • All data resides in YAML, for optional sysadmin friendly hand editing, but everything can be edited in the GUI
  • Packages in REM are a hierarchy of tagged data by dictionary/hash key, with data indexed underneath.  The bread crumbs in the above picture show this: test.yaml >>> jobs >>> tester >>> tester2
  • Leaf nodes can be grouped in a deep hierarchy, to make it easy to organize the nodes.  Nodes can be copied and pasted to other similar hierarchy types (Schema Sections)
  • A package is specified by a Schema Instance, and then is instantiated by a Schema Instance Item.  There can be any number of items per Schema Instance, so that packages can be defined as a specification of specifications, but then instantiated with custom data and custom usage of the specification so that a general outline can work for many different projects.
  • Packages are essentially equivalent to “distributed programs”, they can specify jobs be run on many different machines, and using many workers per job if desired.  Jobs can return output or save results to a message queue, which can be graphed and analyzed with custom SLAs, which can have alerting or meta-analysis data stored.  This is considered the normal desired case for any job, and is not a theoretical “it can be done”, but it is assumed all jobs will potentially want graphing on results, and alerting or automated responses kicked off on data being out of specified tolerance over a period of time, or meeting a test scripts criteria.
  • Packages can mount web pages and RPC functions specified in them (default Sections, ‘http pages’ and ‘http rpc’), and use other packages as fall backs for misses, so that they can extend custom functionality of base packages, and reuse where standard results are desired.
  • Packages are meant to be used as a data based Domain Specific Language.  Organize the data into actions and groups, and then the Section specifier will process the data, as if it was a language.  In this way plans can be built, and the package substitutes for a normal program’s core architecture starting from Main() and initializing state and running code.  All of this is specified in the Package, and the data’s hierarchy serves as the architecture of when scripts should be called, and what data should be passed to them.

Here’s the data that is being edited:

jobs:
 tester:
   tester1:
    script: /tmp/tester.py
    name: Tester Script 1
    title: Tester Script 1
    command: null
    workers: 1

   tester2:
     script: /tmp/tester.py
     name: Tester Script 2
     title: Tester Script 2
     command: null
     workers: 1

The Schema Section, which is what will be processed, has 2 grouped index layers, the 1st being an actual group, “tester”, and the 2nd layer being the labels for the ‘jobs’ item data.  Grouped indexes can be any depth, and field names are assigned to the indexes, so that the final item data collects new fields along the way, picking up it’s hierarchy position as field information.  In this case, it is specified as:

# Indexes we keep to reference this data, grouped in layers
grouped indexes:
 - index: group
   type: text

 - index: null
   key field: name

Which means that either of these items will also have a field ‘group’ with the value ‘tester’.

Sections can contain other Sections, so can can be layered as deeply as required.  It can also be linked out to other files in several different ways to create various types of relationships.

Sections specify all the scripts association with the section, the most basic being the ‘process’ script, which in the case of the ‘jobs’ section starts up jobs (Python scripts, in this case) through the Job Manager, which can run jobs on the current host, or schedule them to be run on remote hosts and receive the results when they complete, or periodically through message queue replication, if the job is long-running.  Replication is built into REM as a core component, as well as shared state, locks, message queues, counters and time series data storage (for graphing and time series analysis).

Sections also specify their fields, including a type and validation.  Types are high level, and have their own schema definition, like the Section specification, they specify scripts to validate, format, save, serialize and performing other operations on the type of data.  Types are meant to be added whenever new basic functionality on data is desired.

Sections additionally specify their rendering information, for instance the edit dialog above was rendered with the following specification:

edit:
 field sets:
   - Job:
     - name
     - title
   - Execution:
     - script
     - command
     - workers

This specifies the order in which the fields are displayed in the Field Set editing dialog box that comes up when you edit a Schema Section Item.  Note there are two field set groups specified to visually separate the fields: ‘Job’ and ‘Execution’.  This can also be used to create a wizard style interface with multiple pages of field set groups.

I’m still working out all the functionality to make the creation of new packages, adding of sections to the packages, and then creating and moving around items under indexes in the sections.  Once that gets worked out, I’ll go back through all the other features done the non-dynamically-edited way, and migrate all their features to working with data in this new way.

Hopefully I’ll have some screenshots of dynamically creating web pages and widgets as part of the tool building process by next week.  After that I’ll put up a demo on EC2 to show it controlling another EC2 instance as it goes through various stages of configuration and forced failures.


The Delay in Release

February 10, 2011

It’s taking a while to get the release together, and it’s going to be a while longer until it is done.  Current guess is maybe 2 months delay.  Primarily, the majority of my time is now directed on other projects, but in addition I ran into the documentation issue.

For software to really be released, it needs reasonable documentation, and the Red Eye Monitor (REM) project is a large and complex project meant to do large and complex things, so it needs documentation that makes at least it’s basic operations clear before it can really launch.

Since I have developed REM to use very loose hierarchical data structures and a loose pluggable architecture, and both can recurse, documenting how this can be worked with would first require explaining all the methods and motives I used to put the system together, which would take a good deal of explanation.

Instead, I’ve decided I’m going to put time into the front-end GUI, so that I can document using the system through snapshots of GUI pages and explanations of the work flow and the schema at each stage.  This should allow interested parties to quickly install and start playing around with configuring it to do new things, and I can defer writing about the internal structure until after it starts getting some install base.


Update: Next Beta Release Includes Usefulness

December 10, 2010

The last beta release (000) ran, but was not especially useful as some of the required features for monitoring and alerting were missing.  The upcoming release (001) will be fully functional and usable for a monitoring and alerting solution (though it is still early in it’s application life cycle).

Things have been delayed a bit, as I have taken the steps to complete the automation platform, and not just the monitoring application.

New pieces:

  • Packaging system: Full life cycle management for adding new components, changing things, updating things, and wrapping all the different kinds of stuff needed for operational automation together.  This includes: HTTP/RPC registration, a state machine for executing long-running code, a job system for executing scheduled code (distributed worker model included), requiring and importing other packages, a module plug-in system, defining data used by the package, and replication for state between nodes.
  • Job Scheduling: One time, recurring, cron-style, worker threads, distributed/remote worker threads.  Job control, and result handling management (replication/storage/processing) are included in the Job scheduling model.
  • Replication: Simple push/pull model for state and queue data for now.  Later this will be expanded by pushing any state changes and slurping back the updates, but for now simple gets the job done and creates an automated flow of information to keep nodes up to date, and deliver results generated locally on nodes to management systems.

These latest modules bring the system from a local Rapid Operations Automation Development System (ROAD), into being a distributed/cluster ROAD.

The Package and Job Schedule system does a much better job of encapsulating code and data to be run on a single system, and make adding more nodes very simple and adds a minimum of complexity.  These also provide all the necessary functionality for doing local agent monitoring and automation, which has been a major delay in finishing the monitoring system’s functionality.

I’m not sure I’ve mentioned this here, but I have a policy of working towards Logarithmic Effort.  I find that many projects fall into requiring Exponential Effort as they progress: for any given change, it takes an exponential amount of effort in coding/testing/deploying to effect the change.

Creating libraries that allow Logarithmic Effort to produce more and more logical content means using Network Effects to create functionality without there being something to actually facilitate it.  The structure and flow of the process creates the effect that might otherwise have been created directly.  This is pretty subtle stuff, and probably sounds like BS, but isn’t.  I’ll try to figure out how to clearly demonstrate this in some of the documentation examples.  Using my system, you get the benefits, as they are wrapped up in the system’s functionality, but I think it would be useful to continue using them in your custom scripts as well.

My goals with infrastructure development are always to work less, but not today, in the future.  So each progression of the Red Eye Monitor (REM) system has been developed with that goal in mind.  Reduce the effort required to do any piece of work to streer towards logarithmic effort, and away from exponential effort.

Where logarithmic effort cannot be enabled, go for linear effort.  The changes can’t be shared, but things can be copy-pasted and changed (using descriptive data, templates and small pieces of isolated-yet-networked code), without side effects or creating more work in the future.

I believe the system I have now is well on it’s way to providing this Logarithmic Effort for creating operational automation, and hoping to be able to start demonstrating that in some articles showing how to build things inside of the REM Package System in the near future.

I’m aiming for having the 001 release and an online demo running this Sunday, and then documentation should begin to flow in after that.  This was also my intention last weekend, so slippage may occur.


REM Monitoring Public Beta

October 27, 2010

Here is the first package for the public beta.

To install this, you will need to have a Linux, FreeBSD or OS X operating system.

You will need python2.6 installed.

Install the PyYaml, jsonlib, setuptools, and Pygments Python packages.

You should have rrdtool and the snmpwalk binary installed, via Net-SNMP, installed on your system.

To install, unzip (sorry about OS X cruft), cd into the main directory, and you will find:

dropstar                jquery_drop_widget      procblock               rem_monitor             unidist

$ cd unidist ; sudo python2.6 setup.py install

$ cd ../procblock/ ; sudo python2.6 setup.py install

$ cd ../dropstar/ ; sudo python2.6 setup.py install

$ cd ../jquery_drop_widget/ ; sudo python2.6 setup.py install

These are also available from PyPI, if you wish to install them via easyinstall.

To run the application:

$ cd ../rem_monitor/

$ ./procblock monitor.yaml

Then point your browser to: http://localhost:2001/system_monitor/monitor

Substitute the hostname for localhost, if connecting remotely.

That’s it.  A proper installer for CentOS, Fedora and Debian, and usage documentation, will be forthcoming in the next few days.


REM Monitoring Talk at Yahoo this Wednesday

October 26, 2010

I’m giving a talk on the REM Monitoring system at the Large-Scale Production Engineering meet-up at Yahoo this Wednesday the 27th.

It will be the first public talk about the REM Monitoring system, and will mark the official Public Beta.  I hope to keep the beta short, to about 3-4 weeks, when the first full release can be made, and the monitoring system itself will stabilize and just get additional monitoring plugins and such.

If you want to take a look at the slides, you can download them here.


“CAP Theory” should have been “PAC Theory”

October 8, 2010

CAP obviously sounds a lot better, as it maps to a real word; that probably got it remembered.

However, I’m guessing it has helped to fail to make this concept understood.  The problem, is that the “P” comes last.

CAP: Consistency, Availability, Partitions.  Consistency == Good.  Availability == Good.  Partitions = Bad.

So we know we want C and A, but we don’t want P.  When we talk about CAP, we want to talk about how we want C and A, and let’s try to get around the P.

Except, this is the entire principle behind the “CAP Theory”, is that Partitions are a real event that can’t be avoided.  Have 100 nodes?  Some will fail, and you will have partitions between them.  Have cables or other media between nodes?  Some of those will fail, and nodes will have partitions between them.

Partitions can’t be avoided.  Have a single node?  It will fail, and you will have a partition between you and the resources it provides.

Perhaps had CAP been called PAC, then Partitions would have been front and center:

Due to Partitions, you must choose to optimize for Consistency or Availability.

The critical thing to understand is that this is not an abstract theory, this is set theory applied to reality.  If you have nodes that can become parted (going down, losing connectivity), and this can not be avoided in reality, then you have to choose between whether the remaining nodes operate in a “Maximize for Consistency” or “Maximize for Availability” mode.

If you choose to Maximize for Consistency, you may need to fail to respond, causing non-Availability in the service, because you cannot guarantee Consistency if you respond in a system with partitions, where not all the data is still guaranteed to be accurate.  Why can it not be guaranteed to be accurate?  Because there is a partition, and it cannot be known what is on the other side of the partition.  In this case, not being able to guarantee accuracy of the reported data means it will not be Consistent, and so the appropriate response to queries are to fail, so they do not receive inconsistent data.  You have traded availability, as you are now down, for consistency.

If you choose to Availability, you will be able to make a quorum of data, or make a best-guess as to the best data, and then return data.  Even with a network partition, requests can still be served, with the best possible data.  But is it always the most accurate data?  No, this cannot be known, because there is a partition in the system, not all versions of the data are known.  Concepts of a quorum of nodes exist to try to deal with this, but with the complex ways partitions can occur, these cannot be guaranteed to be accurate.  Perhaps they can be “accurate enough”, and that means again, that Consistency has been given up for Availability.

Often, giving up Consistency for Availability is a good choice.  For things like message forums, community sites, games, or other systems that deal with non-scare resources, this is a problem that is benefited by releasing the requirement for Consistency, because it’s more important people can use the service, and the data will “catch up” at some point and look pretty-consistent.

If you are dealing with scare resources like money, airplane seat reservations (!), or who will win an election, then Consistency is more important.  There are scarce resources being reserved by the request; to be inconsistent in approving requests means the scarce resources will be over-committed and there will be penalties external to the system to deal with.

The reality of working with systems has always had this give and take to it.  It is the nature of things to not be all things to all people, they only are what they are, and the CAP theory is just an explanation that you can’t have everything, and since you can’t, here is a clear definition of the choices you have:  Consistency or Availability.

You don’t get to choose not to have Partitions, and that is why the P:A/C theory matters.


REM Monitoring Demo

September 29, 2010

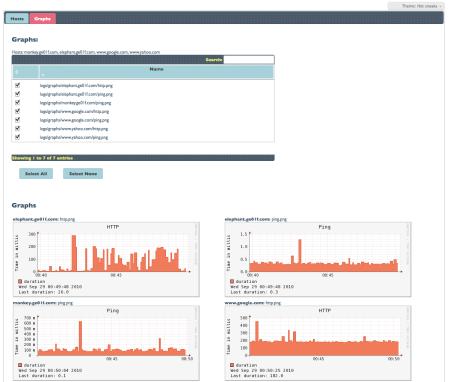
The first REM Monitor demo is now up:

http://ge01f.com/test/system_monitor/monitor

This demo shows monitoring remote hosts via ping and HTTP.  Host monitoring is off because graphing has not been optimized enough yet to not take up a majority of machine resources when there are hundreds of graphs that can be rendered.

Hosts can be added or removed, and new HTTP alerts can be added.

More to come…  SNMP Host monitoring, SLAs based alerts to role accounts with shifts and prioritized contact lists with delay between escalation pending alert acknowledgment.  Among other things.

You can see the old Local System Monitoring Demo, showing a set of host monitors, here:

http://ge01f.com/sys/system_monitor/


GUI Editor Teaser Image

September 22, 2010

I am about a week away from releasing the “REM Monitoring” package, which will be the first of the product releases from the REM suite.

Currently all the local and remote-local-collection monitoring is done, and I have been wrapping up a GUI editor for easy creation of monitoring, dashboard and other general purpose web development for REM tools.  The GUI relies on jQuery and a lot of awesome UI plugins developed by the community, which I have integrated and added to a common widget rendering Python library called jquery_drop_widget.

The next post should have the Alpha release of the REM Monitoring package and initial documentation on how to use it, including the GUI page and widget layout system.

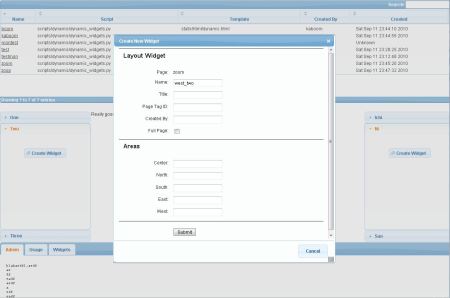
Here is a screen shot of a full page layout getting a new widget created:


Another Demo: No Relay Chat

August 25, 2010

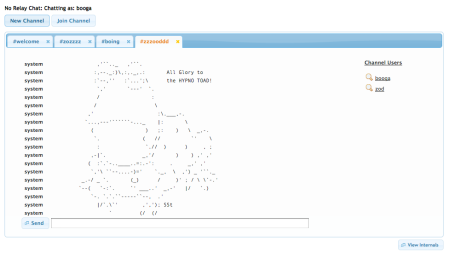
As another demonstration of how the unidist library can be put to use, primarily using shared state and message queues, I wrote an IRC-like web based chat server named No Relay Chat.

You can download the No Relay Chat Demo here, at procblock package’s Google Code page.  You’ll also need the latest procblock, which is on that page.

Below is a screen shot, but here is an online demo. Log in and make some channels.

There is a bug that appears intermittently with the New Channel pop up dialog,  close and try again or reload the page if you’re still interested at that point.  Also, closing a channel also intermittently seems to not unsubscribe, I may be missing a JS error on some case, or there could be a race condition setting channels again after unsubscribe or something.  The communications has always been solid and reliable, so I’m guessing it’s something like this.  I’ll clean those up over the next few days.

At a later date I’ll wrap this up into a full page with IM, ops, moderation, invite/secret channels, and other IRC goodness so it is more useful, and then I’ll package it up for easy installation via RPM/MSI/etc.